- Thermochemistry
- Equilibria
- Kinetics
Spectroscopy
- Absorption
- Emission
- Kinetics
- Dynamics
Overview of Key e-Science, Data Processing, and Visualization Tools
UltraFit provides a set of e-science tools for consistent handling of experimental data and associated modelling.
Core functionalities include graphical visualization, data processsing, and associated modelling of time-resolved data.
Standard tools for intial data processing include: (i) chirp correction, (ii) background subtraction, (iii) solvent subtraction, (iv) scaling and calibration of spectra, (v) smoothing/binning, and (vi) selection of active spectral regions.

Figure 1. UltraFit consecutive target model of transient absorption dynamics in a prototype transition metal complex.
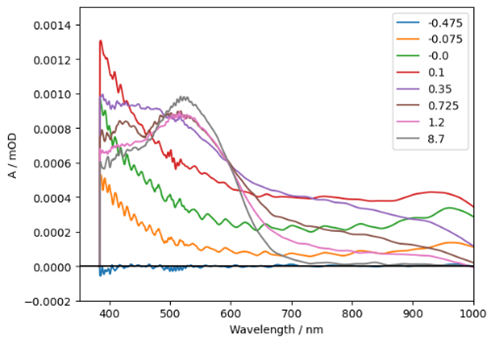
Figure 2. UltraFit visualization of transient absorption dynamics in a prototype transition metal complex.
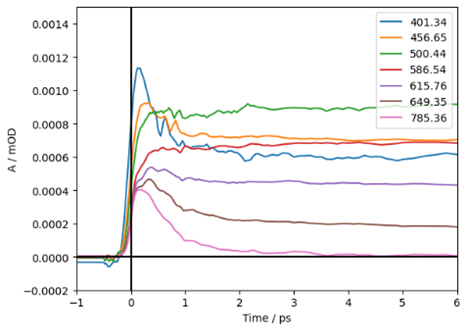
Figure 3. UltraFit visualization of transient absorption dynamics in a prototype transition metal complex.
Global analysis of multi-exponential decay available for selected kinetics ("multi-kin" mode) or full ("regular" style) TA matrix.
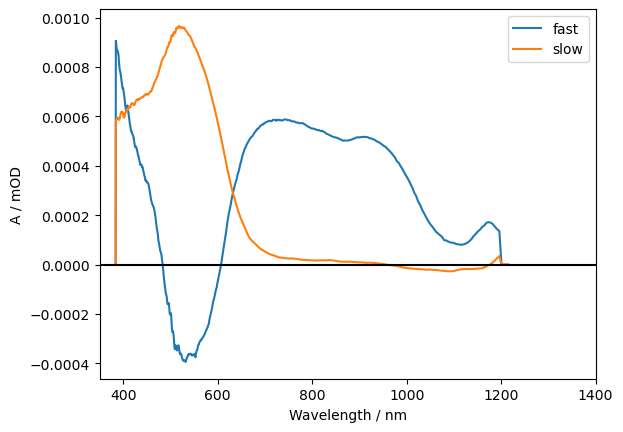
Figure 4. UltraFit visualization of decay associated spectra ("DAS") from a two-exponential fit of transient absorption dynamics in a prototype transition metal complex.
Target analysis of reaction dynamics capable of fitting experimental TA dynamics using different types of reaction models including regular consecutive and parallel reaction schemes as well as general reaction dynamics.
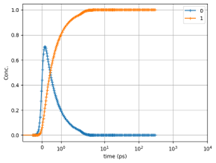
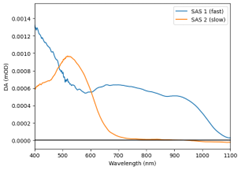
Figure 5. UltraFit Target analysis with a two-species consecutive population dynamics model and corresponding Species Associated Spectra ("SAS").
The scientific tools are currently available for free testing for educational use and academic research subject only to correct citation to the relevant Hesperus.se resources of any disseminated material that has been generated from the UltraFit e-science tools.
For professional use by companies and other for-profit entities, please contact support@ultrafit.se for quotes and conditions.